At a Glance
|
Overview: Each student created their own survey and collected data in math class. They came to computer class and created a "visual representation" of their data.
|
Grade Level: K-2
Time Required: 1 to 2 computer class periods
Curriculum Connection: This lesson is done in conjunction with the First Grade Investigations Math curriculum where the students are learning about creating graphical "representations".
|
Vocabulary
|
Tech Skills - Use Pixie
|
Planning Ahead
ResourcesCreate two Pixie templates. One for a bar graph and one for any other graph. These templates need to be placed in
|
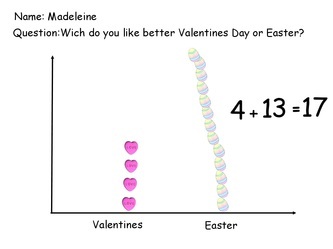
Preparation - Math Class SurveyIn math class, students create their own survey question and then survey their classmates for responses. Here are some examples:
The math teacher provides a worksheet with:
Students come to computer class with their worksheet from math class.
|
Instructional Plan
We start the class off discussing the importance of making a graphical representation. A good graphical representation lets people quickly understand the data without analyzing a lot of numbers.
|
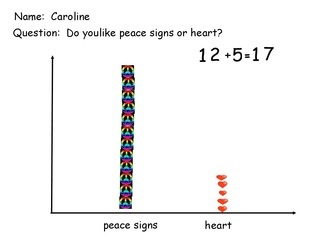
In the following bar graph example, it is easy to see that more students liked peace signs than hearts.
|
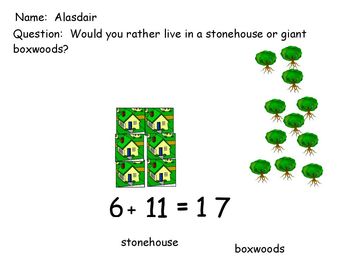
In the following representation, it is easy to see that more students want to live in a boxwood.
|
|
Here is a video that demonstrates how to make a graph using Pixie. The survey question is "What would you rather have a cat or dog". The response to the survey: 6 cats and 10 dogs.
|
Assessment
Checklist:
- Did they add their name?
- Did they add their question?
- Did they have a sticker for every response in their survey?
- Is their graph visually accurate?
- Did they include their "items"?
- Did they stamp their equation?
- Did they capitalize and punctuate properly? Spelling is based on the classroom teacher's preference. They should come to class with the spelling for the project.